|
Up | |||
|
Growth on Two SourcesModel Growth on Two Sources also is taken from Odum's book “Computer Minimodels and Simulation Exercises for Science and Social Science”. For more information about the model and its representation, go to http://www.unicamp.br/fea/ortega/ModSim/two-source/source.html
Follow next steps to draw the system diagram and simulate it:
1. Run the EmSim program. 2. Choose create a new model
3. You will need to use tool bar elements:
4. Draw Source, Storage, Split and Interaction by choosing the correct tool bar element and drop it in the the graph area (main white area). You should draw a rectangle with the mouse in the graph area. Click the mouse left button and hold pressed with defining the first corner of the rectangle and release the button by defining the opposite corner. The rectangle becomes the bounding box of the component selected. Draw all Nodes as they are in the system diagram showed above, also including Pathway Split Node.
5. Choose the Pathway from the tool bar and connect them with Pathway by using correct ports. Pathways should be properly connected: they should be connected to cell ports. With a mouse roll over the Storage (or other) node while appear the port (5.a), then click mouse left button and hold the button pressed (this define the source of the Pathway) and approach the mouse cursor till the Interaction till appear port (5.b) and release the mouse button (now you define the target of the Pathway).
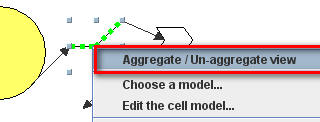
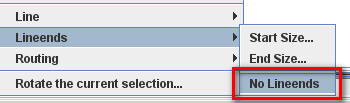
6. Draw all the Pathways as they are shown in the diagram above. In the same way you need to connect the Pathways with Split (6.a and 6.b) and then choose Split (6.c) and by the mouse right click open fast menu and choose Aggregate/Un-aggregate view (6.d)(this option is "hiding" the Split to make system diagram more fine). Also choose the line (marked in 6.e), click the right mouse button to open fast menu to reduce the line end - No Lineends (6.f).
7. If you need to change sizes or placement of Nodes and Pathways, remember before dealing with graphical interface to click on the cursor button, otherwise you will continue to draw Nodes or Pathways.
8. If you want to make Pathway lines curved, you have to add more control points. By the cursor you have to click on the desired Pathway (8.a) and then to choose the location of the Control point and by pressing Shift to click the mouse right button. Then move this control point where you want by pressing and holding the left mouse button (8.b). Add as much as you want. To delete a Control point, select it with the cursor and again right click the mouse right button while pressing Shift.
9. If you want to write the name for the Nodes, by cursor choose the Node and at the Menu choose Edit and again Edit (9.a). Enter the name of the Node (9.b) and press Enter. The same procedure is for Pathways and other graphical nodes.
10. Now your system diagram should look like:
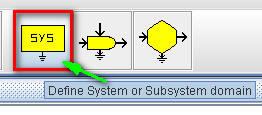
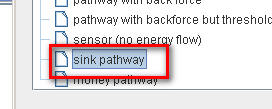
11. Only for graphical purposes you can also draw System frame (11.a) and the Sink Pathways, what is needed to be drawn like a Pathways (11.b), but you have to change the Pathway style: open fast menu by the clicking mouse right button on the chosen pathway (11.c) Choose a model and choose sink pathway(11.d). Draw all desired Sink Pathways, reduce Lineends (see 6.f, 6.e) and then click on System frame and open fast menu by the clicking mouse right button and choose Connect to new sink symbol (11.e) and then you will have a result (11.f).
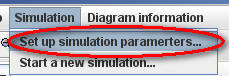
12. To simulate quantity evaluation the model Growth on Two Sources at the Menu choose Simulation/Set up simulation parameters.
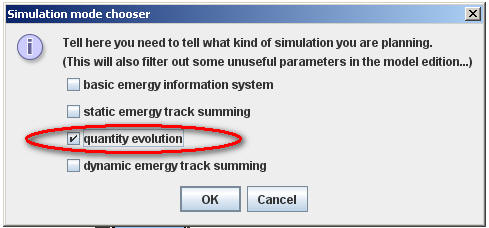
13.Automaticaly will be open Simulation mode chooser where you have to choose the type of modeling. We are going to chose quantity evolution and then click OK.
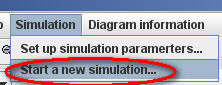
12. Then at the Menu choose Simulation/Start a new simulation.
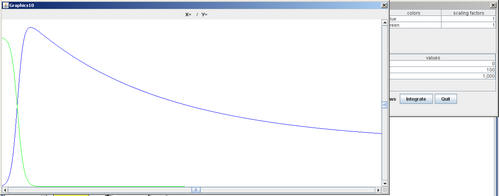
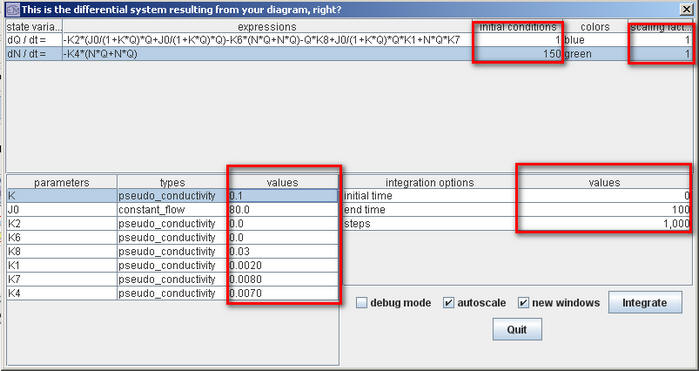
13. Automatically will be open Plotting window and behind it Simulation panel. In the Plotting window will be integrated an plotted the Storage quantity with automatically setup values. The Plotting window can disappear, but you can plot it again in the pressing Integrate in the Simulation panel. Choose the Simulations panel to set up your own parameters.
14. At the Simulations panel you can check the differential equation, enter your own parameters, initial conditions and values (you can change only values marked with the red frame) by double click. When you click with mouse cursor on parameters, the correct Node or Pathway will mark out (marked with the green in the picture). When you have entered all the needed information, click Integrate to see the new plot.
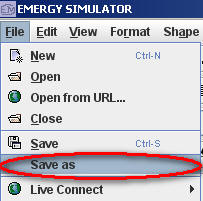
15. Save the model file each time with the different name to avoid errors in the file:
|
||||
|
______________________
|
||||
| Home | Page Up | |||


 5.a
5.a
 5.b
5.b  6.a
6.a
 6.b
6.b 6.c
6.c
 6.d
6.d 6.e
6.e
 6.f
6.f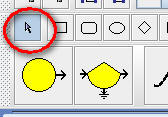
 8.bt
8.bt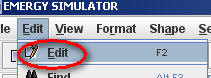 9.a
9.a
 9.b
9.b
 11.a
11.a
 11.b
11.b  11.c
11.c
 11.d
11.d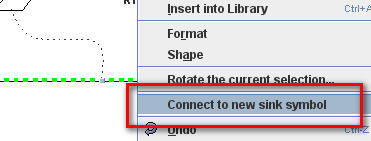 11.e
11.e
 11.f
11.f